



Bitcoin dipped to about $80,000 on October 15, tripped the stops sitting there, and was back above the line within the hour. The bounce was clean, and it was also the least interesting part of the week. According to Glassnode’s Week 42 on-chain report, the more important question is who was defending that level, and whether they have the firepower to push price higher.
The data suggests the floor is real, but it is held up by investors protecting their own break-even, not by a fresh wave of demand.
What the $80K Sweep Actually Showed
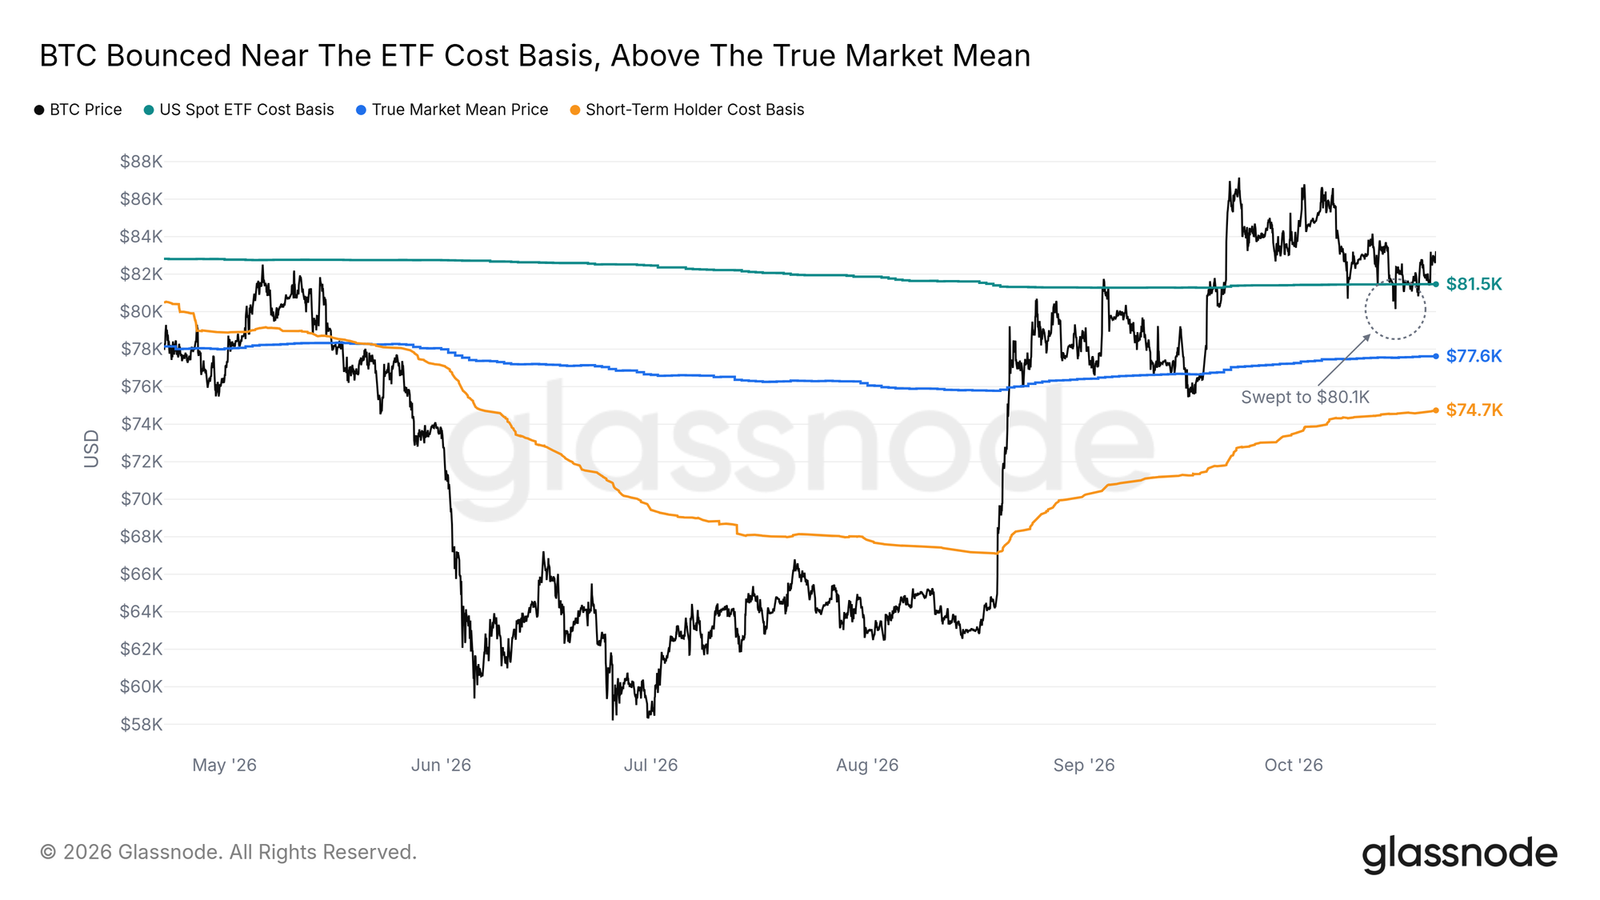
The hourly close touched $80.1K, then the next hour closed back above it. That level is not arbitrary. It sits close to the average price the US spot ETFs paid for their coins. Bitcoin has traded around it since October 8 and dipped under it several times.
History makes the bounce more meaningful. In the spring, the same line acted as a ceiling. Price stalled beneath it in early May and did not post an hourly close above it until September 3. Now it works as support, which is the kind of flip technical traders look for.
Deeper support exists too. The True Market Mean, the average cost basis of active investors, sits near $77.6K, and the sweep stopped well short of it.
A Floor Made of Break-Even Holders
Here is the part most headlines will miss. Treasury companies hold their Bitcoin at an estimated average cost of about $80.2K, almost exactly where the ETFs sit. With both cost bases between $80K and $81.5K, the sweep tested two of the largest holder groups at once. A daily close under $80K would put both at a loss on average.
That explains the defense, but it also exposes the weakness. Treasury buying has faded: every month since June has added less than a tenth of the November 2024 peak. Price has closed above their cost basis every day since September 18, yet they are not buying like they used to.
The order book tells a similar story. The big block of bids on Binance spot at $80K was mostly eaten during the dip. By October 20, it had refilled, though smaller than before. Buyers still want Bitcoin at $80K. They just aren’t chasing it.
The Ceiling Is Crowded
Above price, supply stacks up in one narrow band. Coins bought six to twelve months ago have a cost basis near $86.7K, down from $88K a week earlier. The main wall of sell orders sits between $86.5K and $87.5K. The two largest liquidation clusters now sit near $85K and $87K.
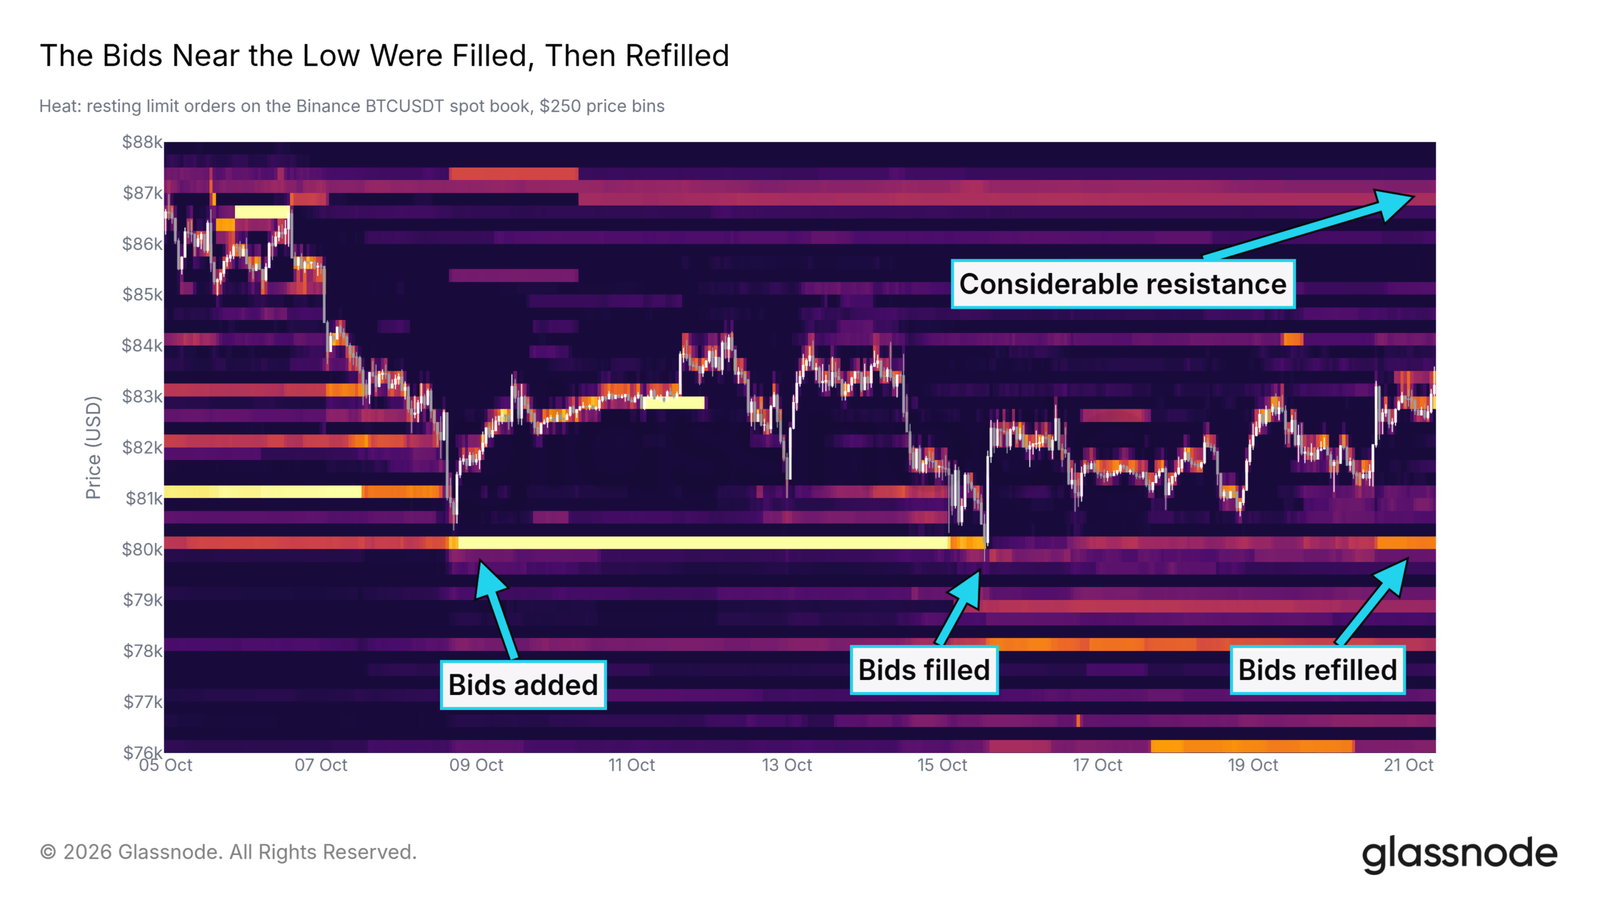
Those pieces matter together. A move toward $87K could accelerate as short positions are forced to close, but it would run straight into the sell orders at the same price. Holders who bought a year or two ago, with a cost basis near $100K, are further above.
There is some good news. Profit taking has slowed to roughly half its pace during the week of the September high. The one-to-two-year holder group, whose selling peaked at the start of October, now moves less than a third as many coins a day. Sellers are tiring, even if they haven’t left.
ETF Inflows Are Back, but the Volume Isn’t
US spot ETFs took in about $653 million on October 19, their biggest day since September 22, flipping the weekly flow back to positive. That deserves credit.
It also deserves context. The funds traded less than usual that day, and their 30-day average volume is under a quarter of its level a year ago. One strong inflow day on thin trading is a signal, not a trend. Glassnode’s own bar for confirmation is inflows repeating on rising volume. Until that happens, the $87.5K wall is more likely to hold than break.
The Strategy and MSCI Risk
The sleeper story is MSCI. On October 15, after the US close, the index provider adopted new rules for what it calls non-operating companies. A test run on May data flagged Strategy and Metaplanet. An existing constituent is only removed if it fails the test in both of its two latest annual filing periods. The final list arrives November 11, with changes effective at the close on November 30.
The market has already reacted. Strategy’s shares fell nearly 10% on October 16, their worst day since February, while Bitcoin barely moved. If Strategy lands on the list, index-tracking funds would have to sell the stock. The next question would be whether the largest corporate Bitcoin holder keeps buying at all, in a market where treasury demand is already running light.
Oil, Yields and the Fed
Macro adds another layer. The Fed meets October 28. WTI crude is up about 73% this year, household inflation expectations are up half a percentage point, and September’s CPI beat forecasts on both headline and core. The two-year Treasury yield has climbed by more than a full point to 4.8%, well above the 4% top of the Fed’s target range even after the September 16 hike.
Bitcoin is up about 10% since that hike, which shows it isn’t trading purely on rates. But if oil keeps pushing inflation expectations higher, a second hike becomes harder to dismiss.
Altcoins Cooled, but Leverage Remains
Altcoins took the hit when Bitcoin dipped. The median altcoin fell about 4% over the following weekend, its largest weekend drop since May. Altcoin froth peaked October 7 and has cooled, and fewer than 5% of altcoins now pay above-neutral funding, versus nearly a quarter in late September. Still, open positions are only about 5% below their peak, so crowding can return quickly.
Bitcoin is boxed in between roughly $80K and $87.5K, with a floor built from break-even buyers and a ceiling built from everyone who wants out at break-even. A daily close above $87.5K, backed by repeat ETF inflows on rising volume, would show demand finally absorbing supply. A close below $80K would put the average ETF and treasury holder underwater and bring $77.6K into view. With the Fed on October 28 and MSCI on November 11, the range probably won’t last much longer.
This article is for information only and is not investment advice. Source: Glassnode, The Week On-chain, Week 42, 2026.